Map out your entire asset base
- We pre-fill your asset information using publicly available data.
- Easily add, edit or remove assets yourself. No additional fees for new locations.
- Full view to your physical asset footprint.
Physical Risk for corporates
Understand exposure to flood, drought, heat, wildfire and other hazards across your entire footprint.
Turnkey solution
Regulatory compliance
Selected excerpts from the 2026 revised ESRS and the EU Taxonomy Climate Delegated Act.
ESRS E1-2
Paragraph 16 & AR 6
“assess how its assets and business activities … may be exposed and be sensitive over the short, medium and long term”
“take into consideration the locations of its assets and business dependencies in its value-chain”
Every asset geocoded and screened against 50+ hazard layers, with NUTS 2 and NUTS 3 returned per location.
ESRS E1-11
Paragraph 39 & AR 32
“the carrying amount of assets at material physical risk … including the relevant time horizons”
“include where relevant the location of its assets at material physical risks”
Your full asset map, with the at-risk locations identified and ready to disclose.
EU Taxonomy
Appendix A — climate risk and vulnerability assessment
“screening of the activity to identify which physical climate risks … may affect the performance of the economic activity during its expected lifetime”
Screening mapped to the EU Taxonomy Appendix A, Section II “Classification of climate-related hazards” table, covering acute and chronic temperature-, wind-, water- and solid mass-related hazards.
EU Taxonomy
Appendix A — climate projections
“highest available resolution, state-of-the-art climate projections across the existing range of future scenarios consistent with the expected lifetime of the activity”
“including, at least, 10 to 30 year climate projections scenarios for major investments”
Historical baseline compared with multiple warming scenarios, including RCP 2.6, 4.5 and 8.5.
EU Taxonomy
Appendix A — adaptation
“an assessment of adaptation solutions that can reduce the identified physical climate risk”
At-risk assets ranked so adaptation measures and further analysis can be targeted.
Hazard coverage
Every location screened against the EU Taxonomy Appendix A hazard classes. From official sources, for the historical climate and forward-looking scenarios.
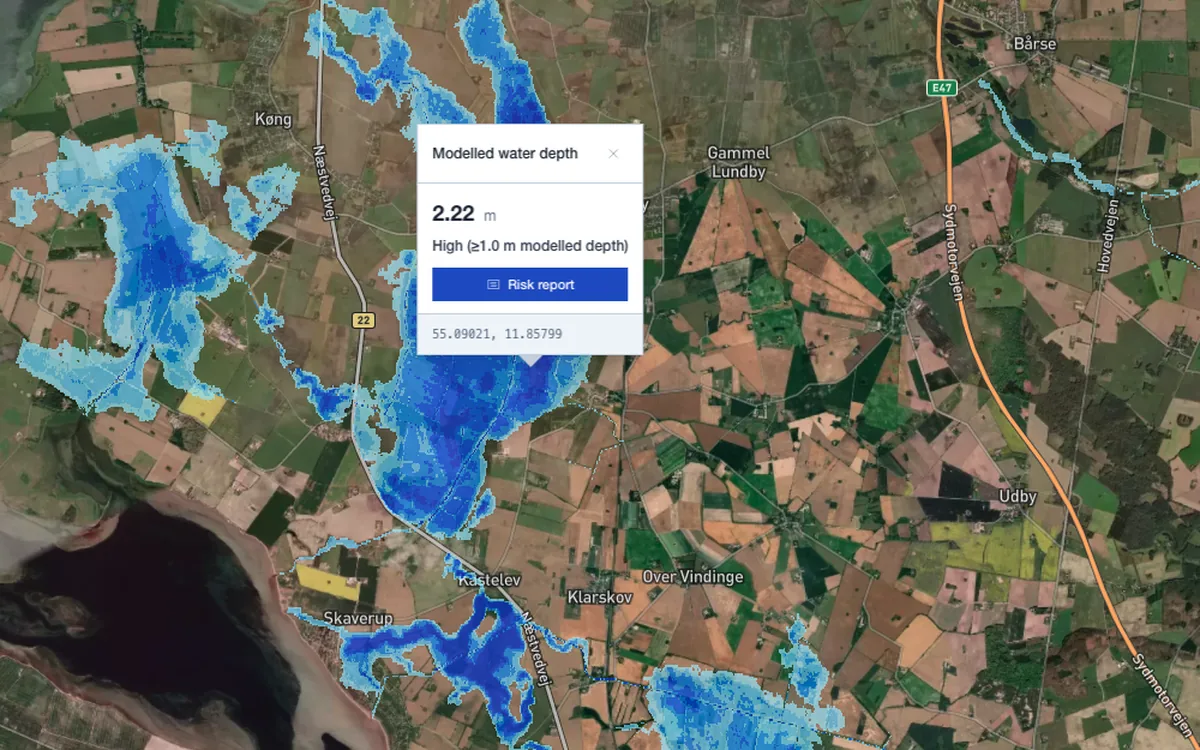
Local and global flood maps, at multiple return periods and climate scenarios.
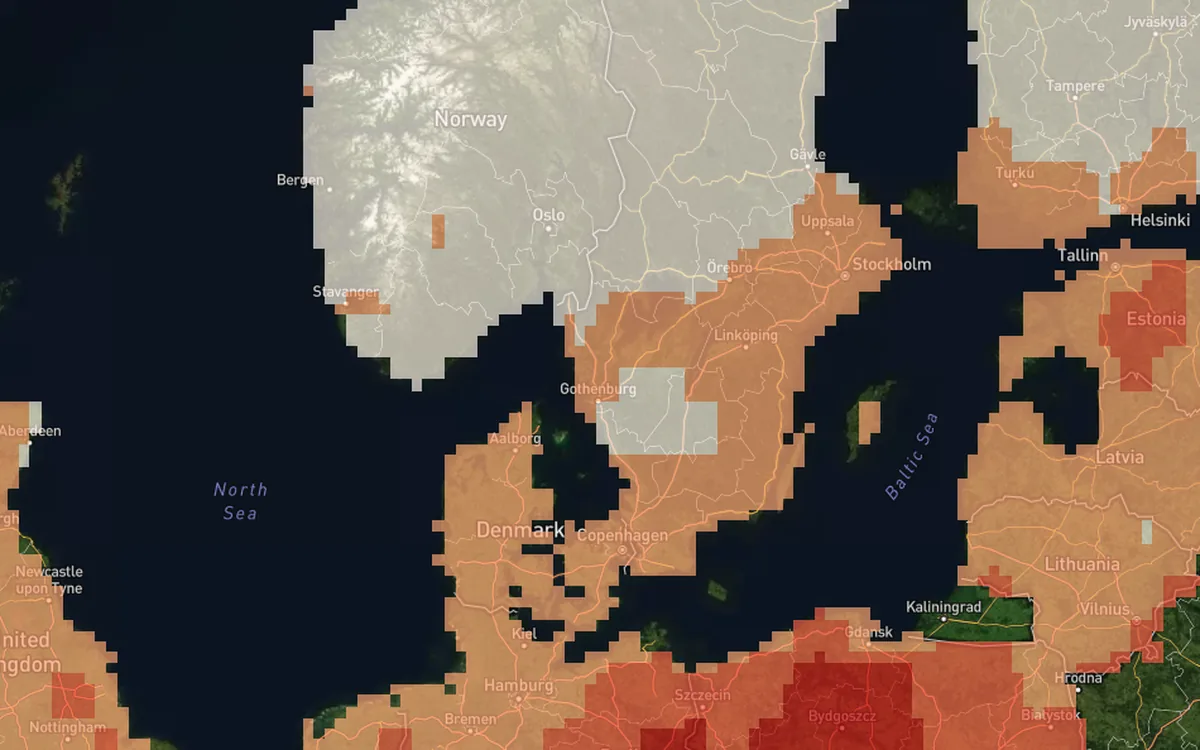
Wildfire hazard from official European and global fire-danger data, at multiple return periods.
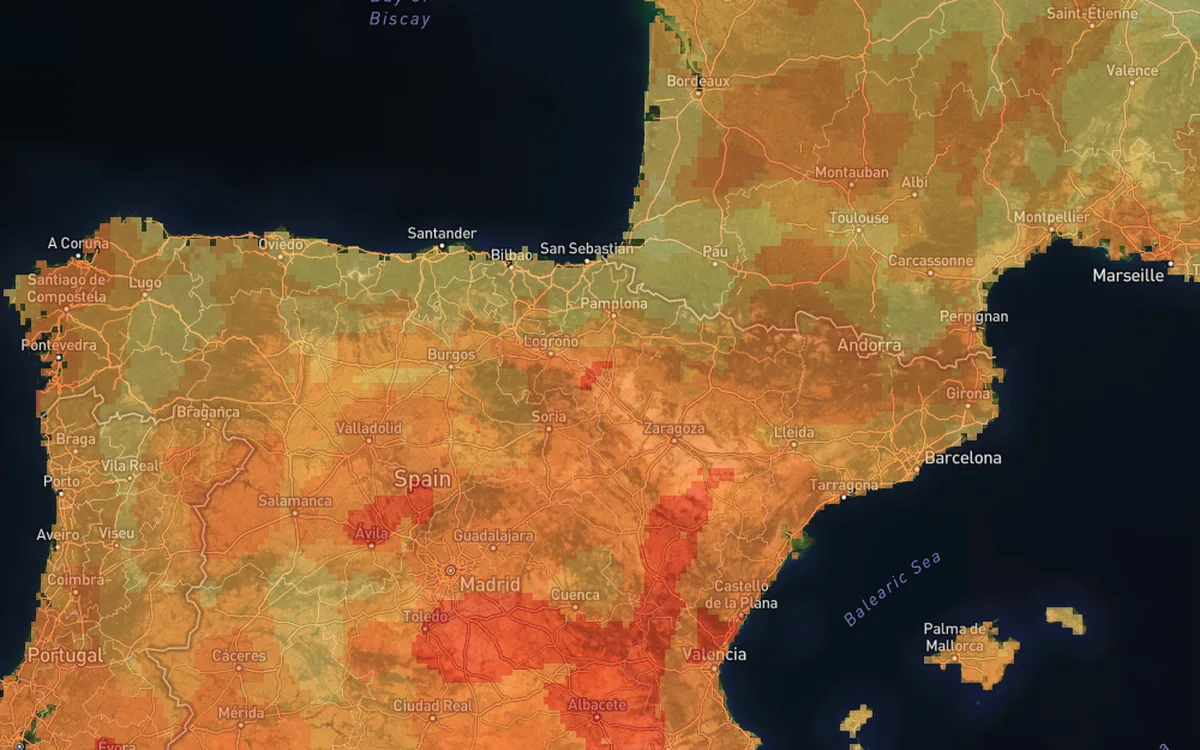
Drought hazard from established global indices, for the historical climate and warming scenarios.
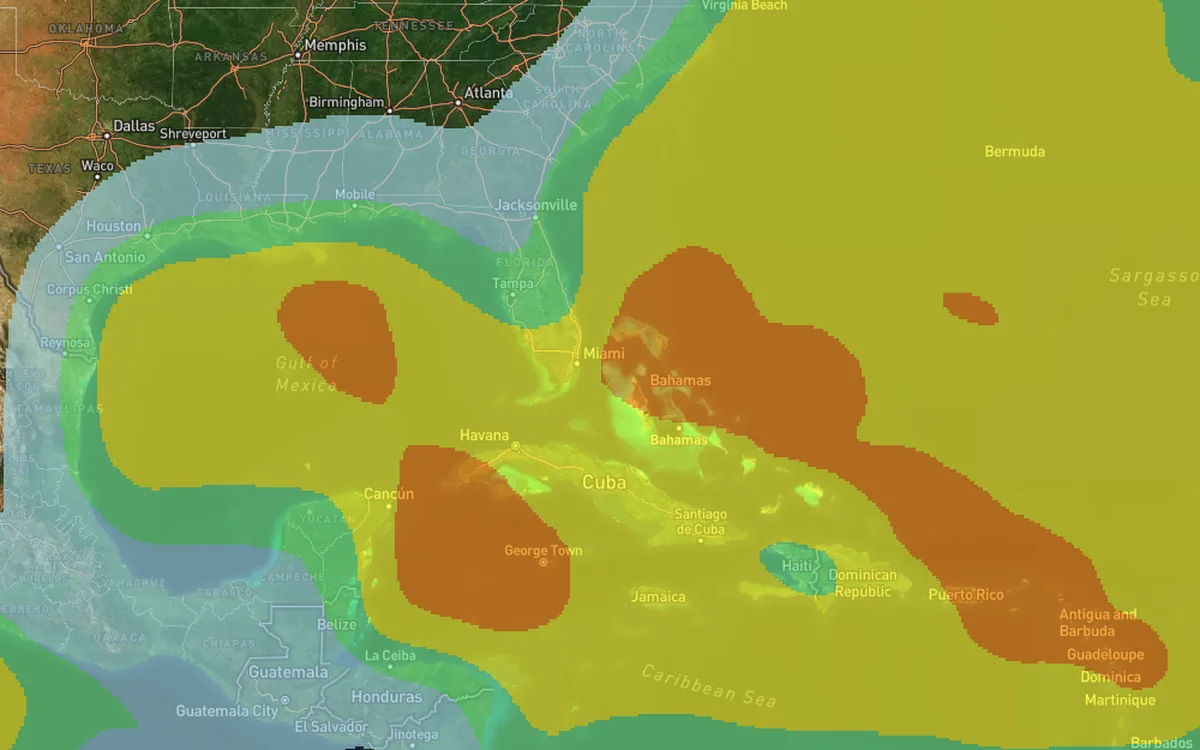
Global cyclone and storm wind hazard, at multiple return periods and climate scenarios.
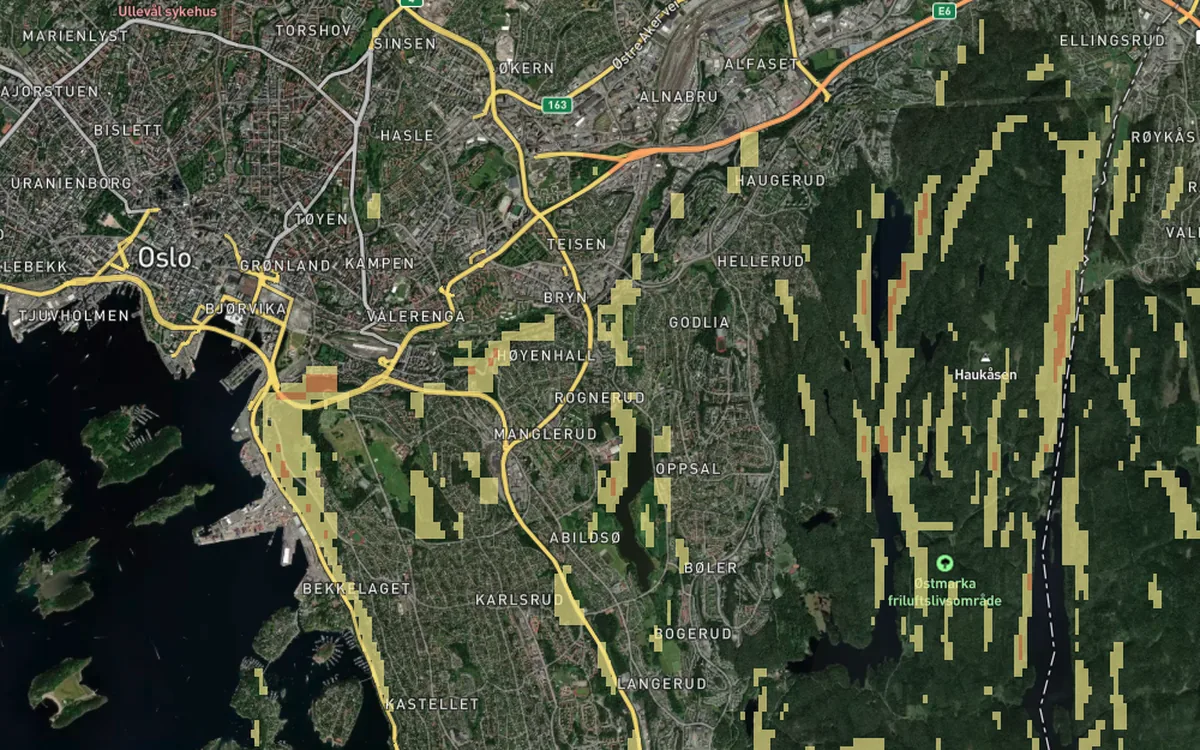
Landslide, subsidence and seismic layers from official geological data, historical and forward-looking.
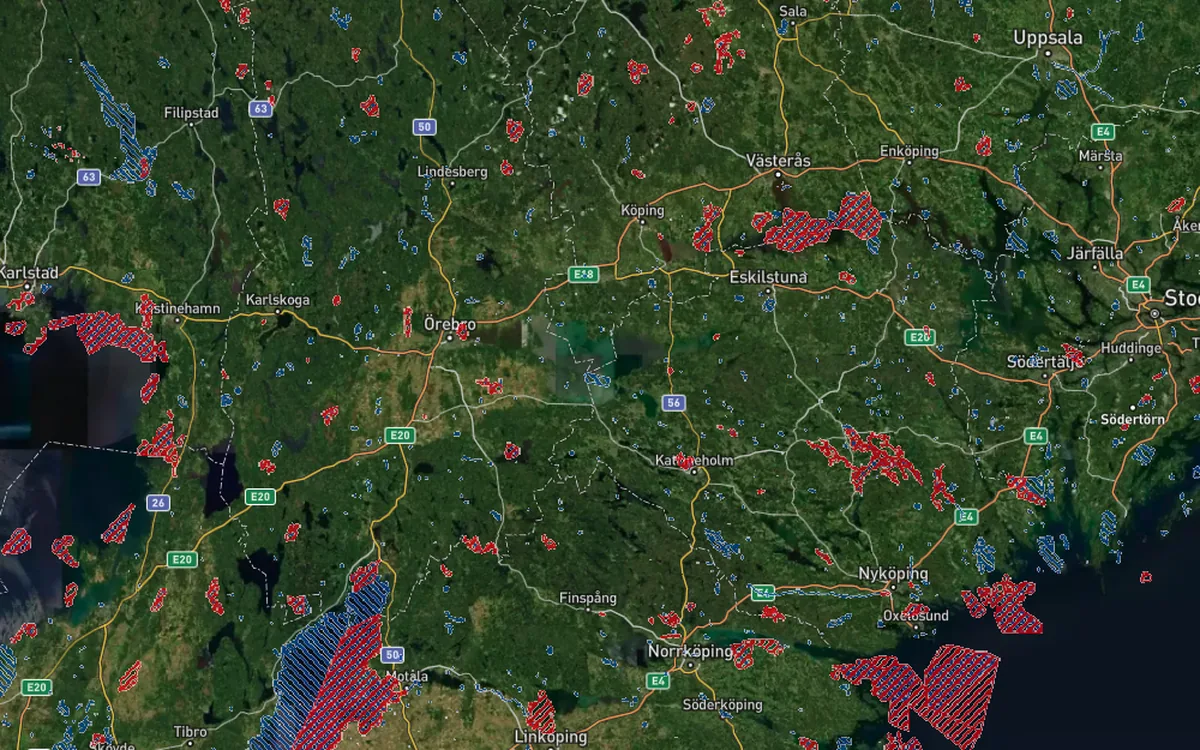
Protected areas and biodiversity designations around each location, including the Natura 2000 network.
Global, European and national sources include: WRI Aqueduct · GIRI · World Bank · JRC DRMKC · Copernicus · EEA · IPCC · MSB · NVE · Kartverket
Map imagery © Mapbox · © OpenStreetMap contributors · © Maxar
Ready to see Klever?
Leave your email, we'll contact you for a walkthrough.
Prefer email? Contact us
We use limited cookieless audience measurement to understand page traffic without storing browser identifiers. Accepting analytics cookies adds session continuity; you can continue without them or disable all audience measurement in the details.