Ask how much of Duisburg is at risk of flooding and you can get three different answers. On the official flood map, 0.2% of the city’s 176,000 buildings are in the 1-in-100-year flood zone. Count the areas that stay dry only because of the flood defences along the Rhine, and it is 44.8%. The European Commission’s JRC flood maps say 18.2%.
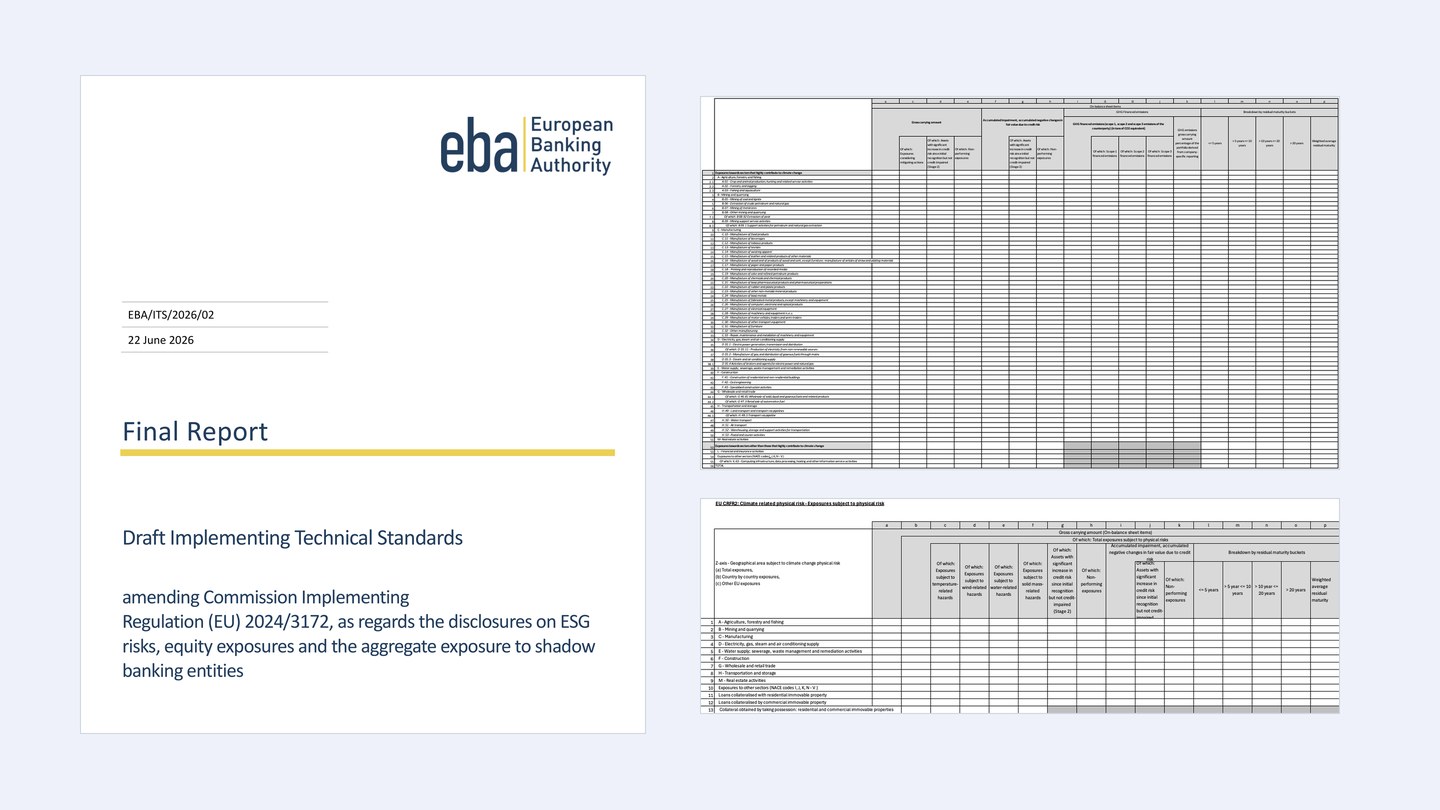
This matters to banks: the revised Pillar 3 ESG templates, expected to apply from year end 2026, tell them to identify exposures subject to physical risk “at a minimum, at NUTS level 3”, which in Germany means the 400 districts. So we matched every building in Germany’s official building data to the official flood hazard maps and added the results up by district.
Where flood risk is highest in Germany
The exposure follows the rivers: the Moselle, the Rhine, the Danube and the Main. 27 of the 400 districts are above 5%, and six in ten are below the national 1.7%.
All 400 districts are on the map below, with the split into homes, public buildings and other buildings. The full table opens with a work email.
Loading the map…
More buildings stand behind flood defences than in the flood zone
The official figures assume that flood defences, meaning dikes and flood walls, hold. Ten of the 16 states also map the areas a 1-in-100-year flood would reach without them. Counting those, 1.96 million buildings are in the flood zone, or 3.6%. So at least 1.03 million buildings rely on river flood defences, nine in ten of them in the four states along the Rhine. The count leaves out Brandenburg, whose maps treat land behind river defences as dry without marking it.
The defended figure describes a 1-in-100-year flood in which the defences hold. The undefended one shows what is at stake if a defence fails or the flood is higher than it was built for. On our map, 18 districts carry a note that they rely on river defences.
Why other flood maps give other figures
Risk tools that cover many countries often use one European or global flood model instead of national maps. The best known in Europe, the European Commission’s JRC flood maps, put 5.0% of German buildings in the 1-in-100-year flood zone, almost three times the national maps’ 1.7%. The main reason is that on rivers they leave out local flood defences. So the same building can be in the flood zone in one tool and outside it in another.
Why we count buildings, not land area
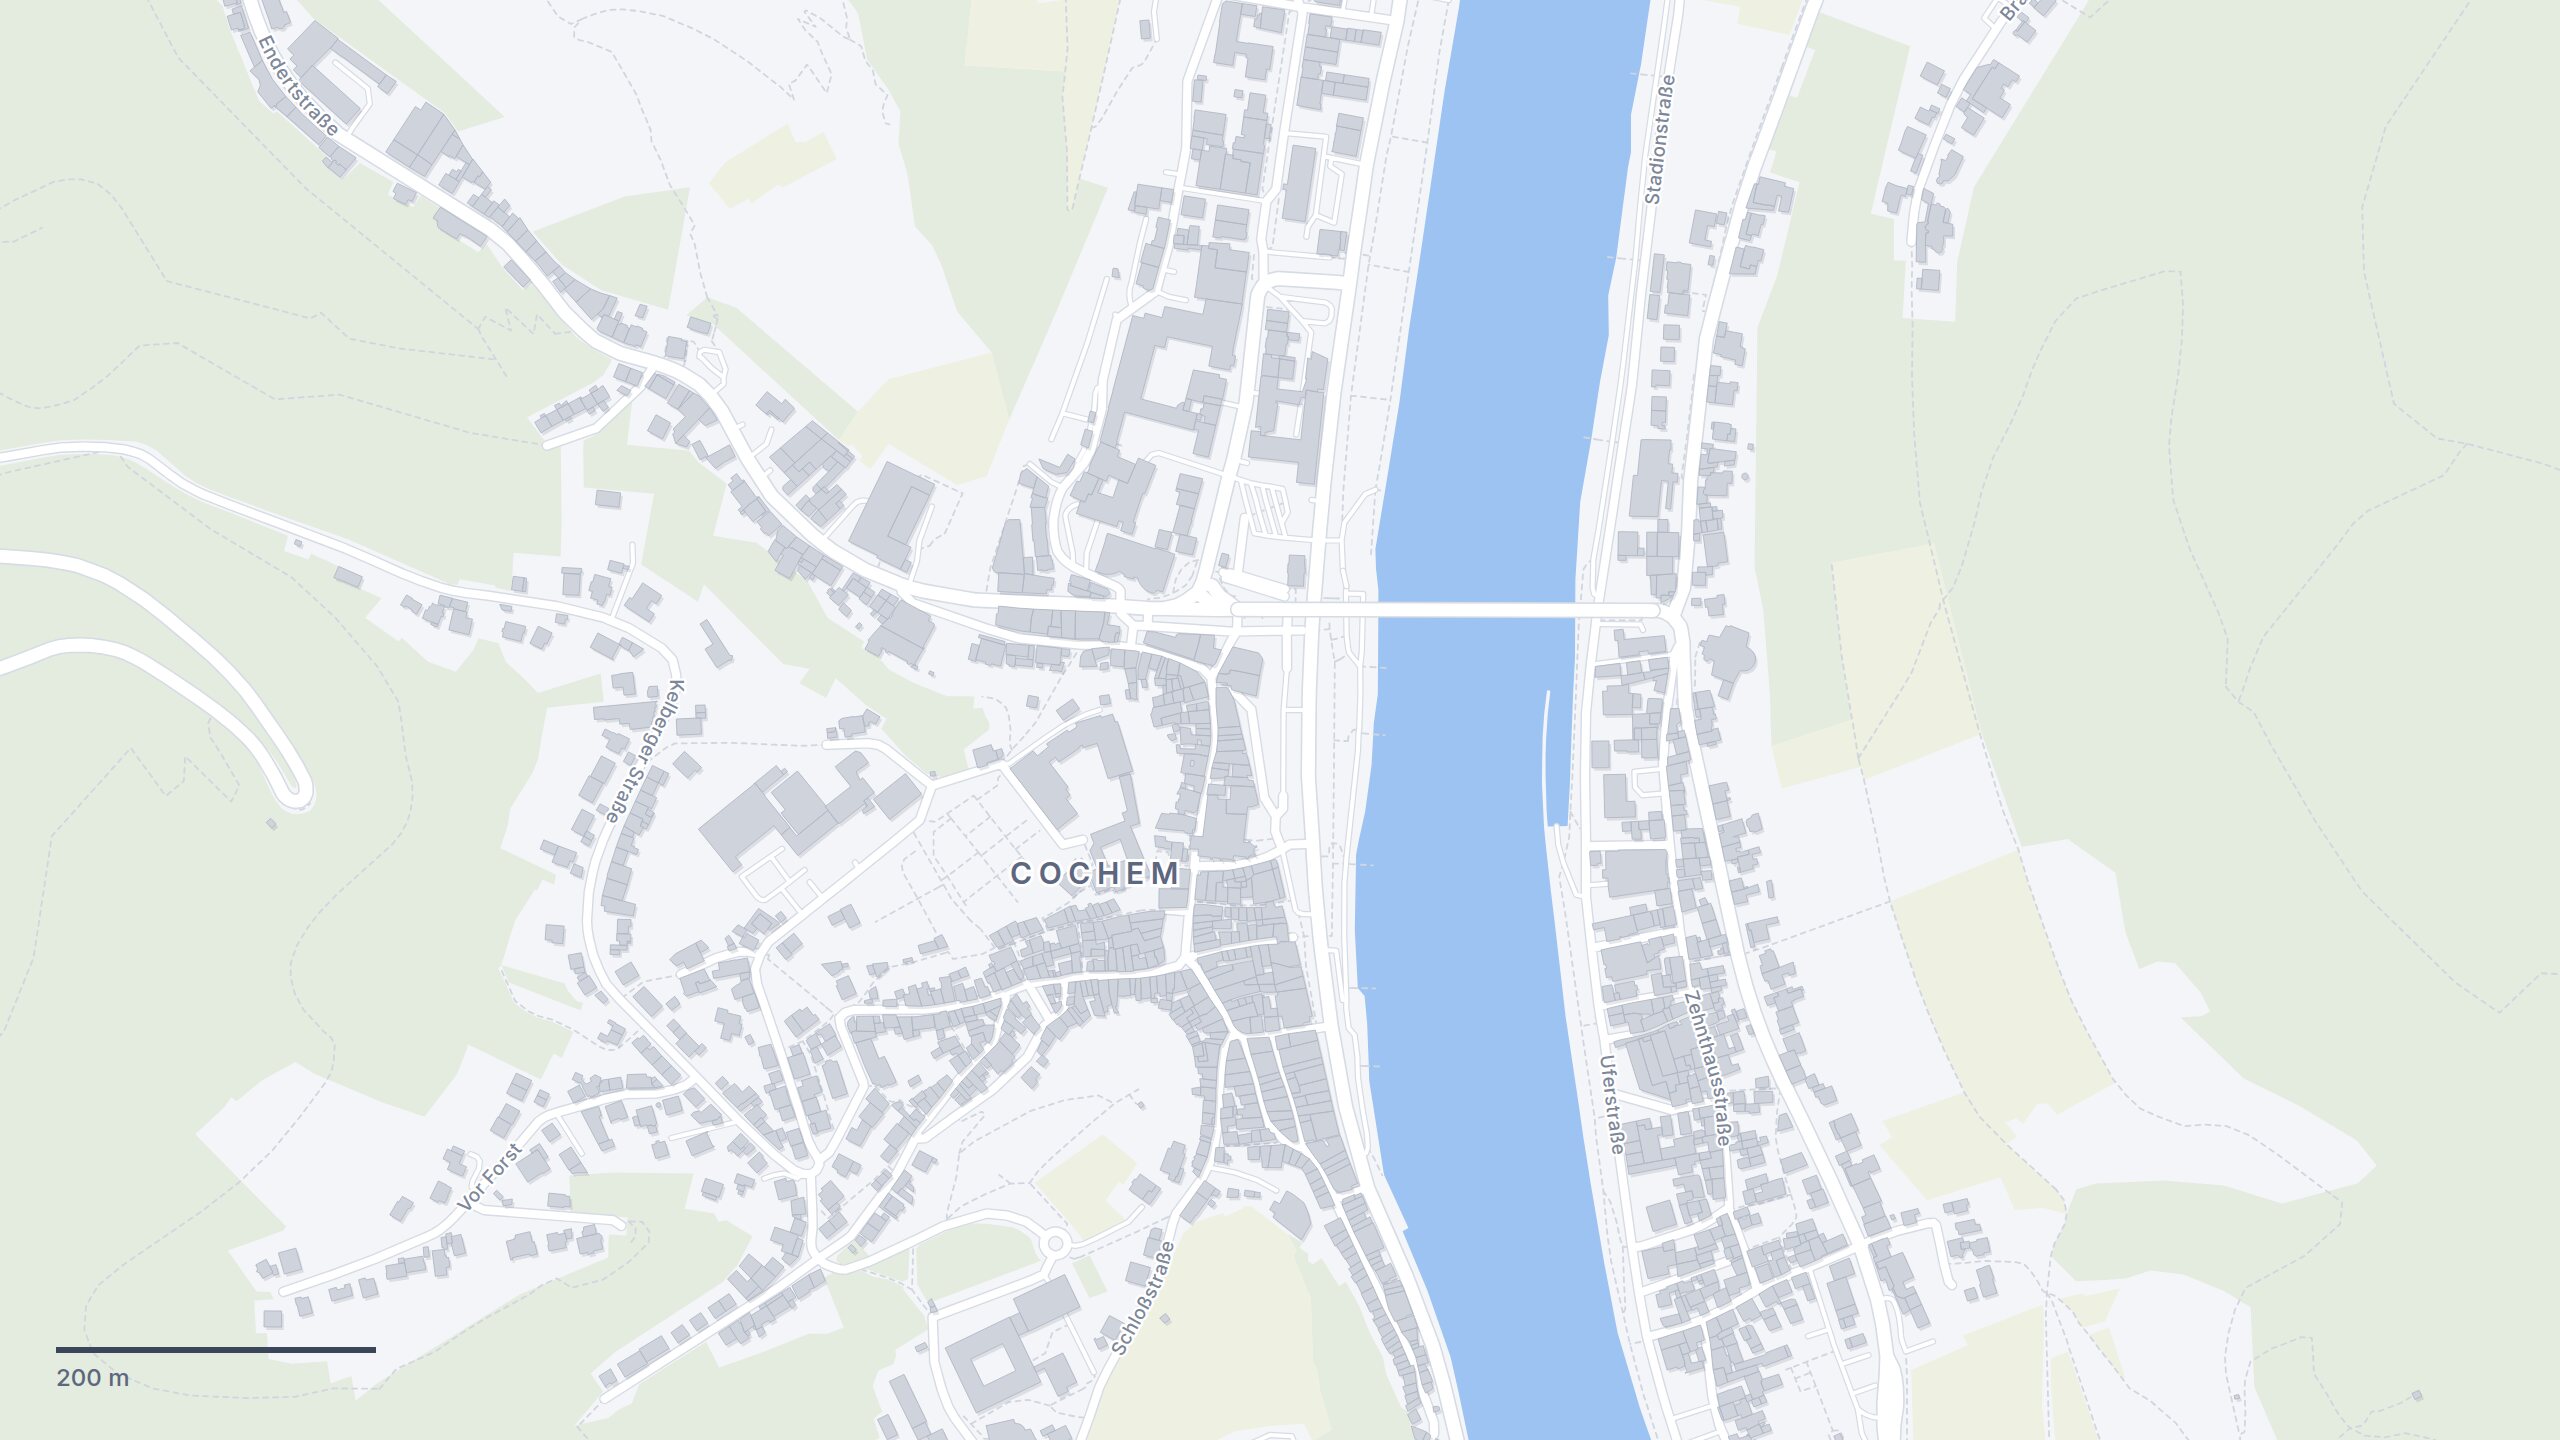
A flood map shows where the water would stand, and most of that is river, meadow and farmland. What a lender has at stake is buildings, and the two can differ in either direction. In Dessau-Roßlau about a fifth of the district’s area is in the 1-in-100-year flood zone of the Elbe and the Mulde, but only 26 of its 49,200 buildings are. In Cochem-Zell on the Moselle it is the other way round: about 3% of the area and 11.3% of the buildings, because the towns stand on the narrow valley floor. In about three of four districts the share of area is higher than the share of buildings.
How we matched buildings to the flood maps
We took the 53.9 million buildings in the federal states’ official building data and the medium-probability scenario of the states’ flood hazard maps, as collected by the Federal Institute of Hydrology (BfG). On rivers that is a 1-in-100-year flood. A building counts when the flood zone covers at least a tenth of its footprint, or at least a quarter of the open ground within a metre of its outline. A building enclosed by its neighbours is judged by the open ground around its block. Areas marked as protected by defences count as dry. Flooding from heavy rain, groundwater and sewers is not in these maps, and they describe present-day flood probabilities, not a warmer climate.
Data: flood hazard maps © WasserBLIcK/BfG and the responsible authorities of the federal states, 2026 (GeoNutzV). Building data © the surveying authorities of the 16 federal states. District boundaries © GeoBasis-DE / BKG 2026 (dl-de/by-2-0). Census 2022 © Statistische Ämter des Bundes und der Länder (dl-de/by-2-0). River and coastal flood maps for Europe: European Commission, Joint Research Centre. The licence of each state’s building data is listed under the map.