Climate

How Europe’s 600 Largest Companies Approach Physical Climate Risk

We analysed the annual reports of STOXX Europe 600 companies. 65% have assessed physical climate risk using the locations of their sites. 19% have modelled expected financial losses.

October 9, 2026
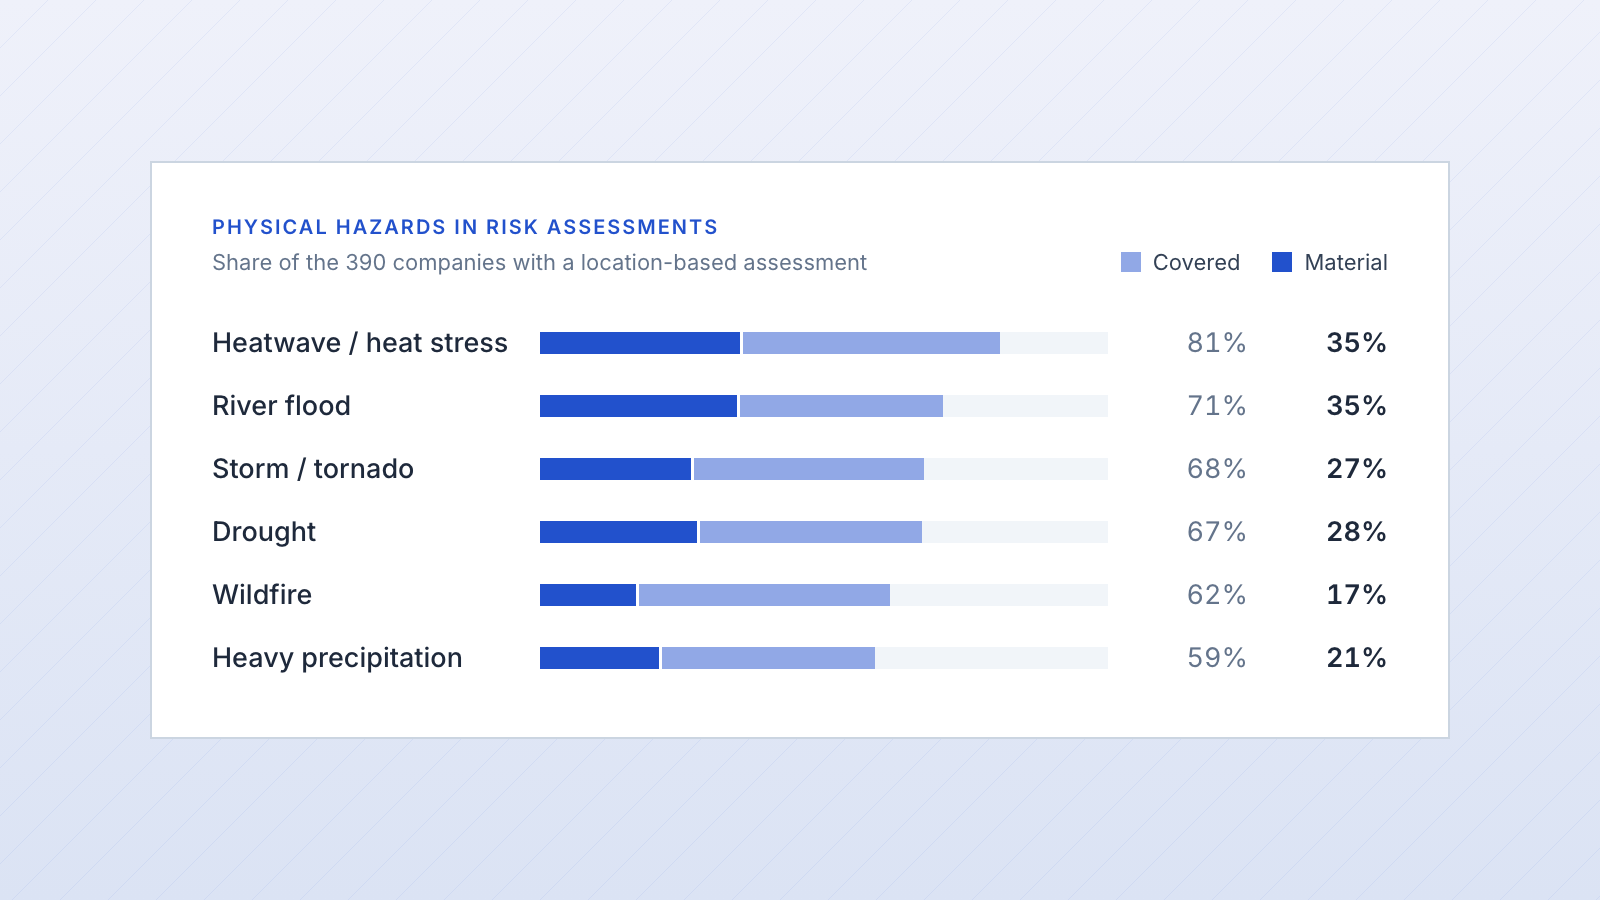
Bar chart of the physical hazards covered and found material by the 390 companies with a location-based assessment, led by heat stress at 81% covered

How do Europe’s large listed companies handle physical climate risk? We ran Klever’s physical risk questionnaire on the latest annual and/or sustainability reports of 596 STOXX Europe 600 companies.

65% have assessed physical risk

65% of Europe’s 600 largest companies have analysed physical risk with their facilities’ location data. 66% of those that have done that assessment found physical risk material. Fewer go further. 19% have modelled potential losses in numbers, and 12% report losses that already happened.

Stage of physical risk work
Assessed physical risk with location dataCompanies: 39065%
Found physical risk materialCompanies: 29149%
Made adaptation investmentsCompanies: 28648%
Has an adaptation plan or targetsCompanies: 23139%
Assessment covers the supply chainCompanies: 18130%
Modelled potential losses in numbersCompanies: 11519%
Reported losses that already happenedCompanies: 7112%
Figure 1: Share of the 596 companies that disclose each item.

RCP 8.5 is the default scenario

Among the 390 companies with an assessment, 82% use the high emissions scenario RCP 8.5. 44% also test the low emissions RCP 2.6. 46% include their supply chain.

Scenarios and supply chain
RCP 8.5 (high emissions)Companies: 31882%
RCP 4.5 (intermediate)Companies: 20352%
RCP 2.6 (low emissions)Companies: 17244%
Covers the supply chainCompanies: 18146%
Figure 2: Climate scenarios used and supply chain coverage. Share of the 390 companies with an assessment.

57% combine their own team with outside help. Only 6% leave the work fully to a third party.

Who did the assessment
Internal and externalCompanies: 22357%
Internal onlyCompanies: 10727%
External onlyCompanies: 256%
Not disclosedCompanies: 359%
Figure 3: Who carried out the assessment. Share of the 390 companies with an assessment.

Heat is assessed most, floods turn material most

Heat stress is the most covered hazard. 81% of assessments include it. River flood comes second. It is also the hazard most often found material: 49% of the companies that assess it say it matters.

Hazards covered and material
Heatwave / heat stressCovered: 31681%Material: 13735%
River floodCovered: 27771%Material: 13535%
Storm / tornadoCovered: 26468%Material: 10427%
DroughtCovered: 26267%Material: 10828%
WildfireCovered: 24062%Material: 6617%
Heavy precipitationCovered: 23059%Material: 8221%
Rising temperature / temperature variabilityCovered: 22357%Material: 7018%
Water stress / scarcityCovered: 22157%Material: 8622%
Sea level riseCovered: 17344%Material: 4010%
Coastal flood / storm surgeCovered: 17044%Material: 6216%
Surface water / flash floodCovered: 16643%Material: 7319%
Tropical cycloneCovered: 16242%Material: 4712%
Landslide / subsidenceCovered: 13936%Material: 369%
Changing precipitation patternsCovered: 13334%Material: 308%
Cold wave / frostCovered: 13134%Material: 318%
Changing wind patternsCovered: 7920%Material: 123%
Coastal / soil erosionCovered: 5614%Material: 103%
Permafrost thawCovered: 256%Material: 00%
Ocean acidificationCovered: 185%Material: 00%
OtherCovered: 15239%Material: 4612%
Figure 4: Hazards covered and hazards assessed as material. Share of the 390 companies with an assessment. Most cover several hazards.

Few put a figure on losses

71 companies say physical events have already cost them money. Only 19 give an amount. Together these losses add up to €6.2 billion. The median is €79 million and the largest single loss €1.8 billion. Business disruption and asset damage are the most common losses.

Financial impacts
Modelled and quantified potential lossesCompanies: 11519%
Reported losses from physical eventsCompanies: 7112%
Disclosed a loss amountCompanies: 193%
Figure 5: Financial impacts. Share of the 596 companies.
Types of loss
Business disruptionCompanies: 3752%
Asset damageCompanies: 3448%
Supply chain disruptionCompanies: 68%
Higher insurance costsCompanies: 23%
OtherCompanies: 3144%
Figure 6: Types of loss. Share of the 71 companies that reported losses.

Adaptation starts with planning

48% of companies have invested in adaptation. Early warning and business continuity planning come first. Flood protection and insurance follow. Only 31 companies say how much they spent. Together that is €1.6 billion, with a median of €3 million.

Adaptation at a glance
Made adaptation investmentsCompanies: 28648%
Has an adaptation plan or targetsCompanies: 23139%
Disclosed an investment amountCompanies: 315%
Figure 7: Adaptation. Share of the 596 companies.
Adaptation investments by type
Early warning / business continuity planningCompanies: 17160%
Flood protection / drainageCompanies: 13848%
Insurance / risk transferCompanies: 13045%
Building / infrastructure hardeningCompanies: 12544%
Water efficiency / alternative sourcingCompanies: 11440%
Cooling / heat protectionCompanies: 8530%
Nature-based solutionsCompanies: 6924%
Supply chain diversification / buffer stockCompanies: 6021%
Resilient products / crops / materialsCompanies: 4415%
Backup power / energy resilienceCompanies: 3412%
Wildfire protectionCompanies: 228%
Site or equipment relocationCompanies: 62%
OtherCompanies: 176%
Figure 8: Types of adaptation investment. Share of the 286 companies that invested.

Spain leads, the UK trails

Practice varies by country. 93% of Spanish companies have assessed physical risk. In the UK, the largest group in the sample, the share is 46%.
Results by country
Spain28 companiesAssessed: 2693%Material: 2279%
France64 companiesAssessed: 5180%Material: 4773%
Netherlands34 companiesAssessed: 2779%Material: 1647%
Italy36 companiesAssessed: 2878%Material: 2467%
Germany67 companiesAssessed: 5176%Material: 3349%
Denmark23 companiesAssessed: 1565%Material: 939%
Switzerland61 companiesAssessed: 3964%Material: 2948%
Sweden49 companiesAssessed: 3163%Material: 1939%
Finland18 companiesAssessed: 1161%Material: 739%
Poland16 companiesAssessed: 956%Material: 956%
Norway20 companiesAssessed: 1155%Material: 1155%
Belgium15 companiesAssessed: 747%Material: 640%
United Kingdom117 companiesAssessed: 5446%Material: 3530%
Other countries48 companiesAssessed: 3063%Material: 2450%
All companies596 companiesAssessed: 39065%Material: 29149%
Figure 9: Companies with an assessment and companies that found physical risk material, by country. Countries with 15 or more companies in the sample.

Related Reading

More from the desk.

Ready to see Klever?

See and try our platform for yourself

Leave your email, we'll contact you for a walkthrough.

Prefer email? Contact us

We use limited cookieless audience measurement to understand page traffic without storing browser identifiers. Accepting analytics cookies adds session continuity; you can continue without them or disable all audience measurement in the details.